
How a Chicago Therapy Practice Cut Ad Spend by 50% While Growing Search Impressions by 153%
Therapists want to spend time helping clients, not worrying about expensive ads. This Chicago practice was spending over $5,000 every month on online ads, but many of the clicks were not turning into actual clients.
We helped them update their website so people searching for terms like "therapist in Chicago," "trauma therapy," and "eating disorder therapy" could find them naturally on Google.
In just three months, they cut their monthly ad budget in half (saving $2,500 every month) while getting even more calls from potential clients. Our monthly service paid for itself right away and built a steady stream of new client inquiries.
Challenge:
Too Much Spent on Ads: Paying over $5,000 a month with fewer new clients to show for it.
Wrong Leads: Clicks from people who weren't looking for their specific therapy services.
Hard to Find on Google: Relying completely on paid ads because their site didn't show up in normal search results.
Actions:
Fixed Website Mistakes: Corrected behind-the-scenes errors so Google could easily read and display their website.
Focused on Specific Therapies: Rewrote main pages so people searching for specific care, like trauma or eating disorder support, could easily find them.
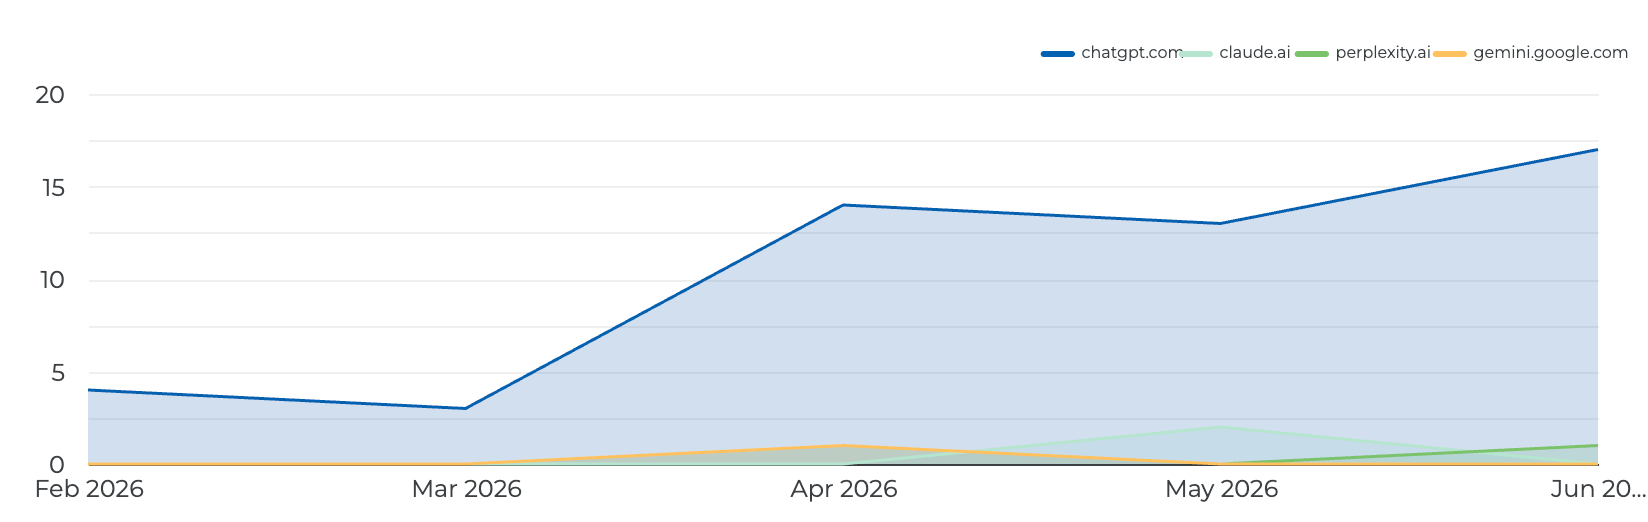
Set Up for AI Search: Made sure their practice shows up when people ask tools like ChatGPT or Gemini for local therapist recommendations.
Ongoing Support: Kept their site updated every month so they continue to rank well.

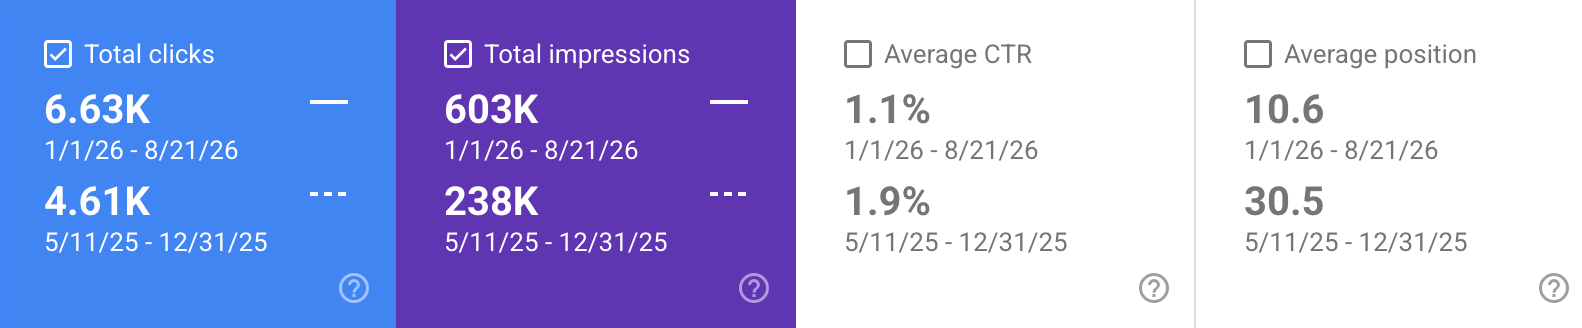
+44% increase
in clicks for all search terms
+153% increase
in total impressions
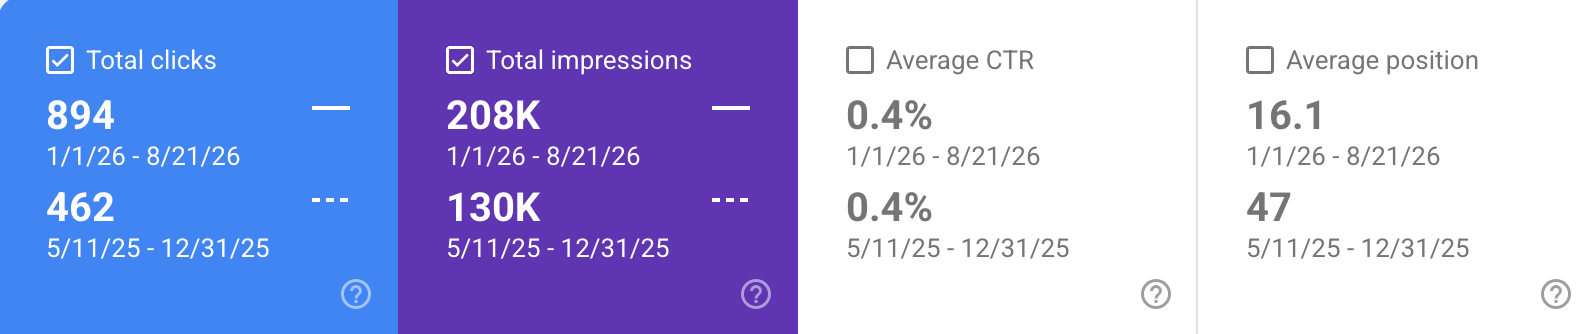
93% increase
in total clicks for unbranded search

Results
All Search Terms
+44% increase in clicks
+153% increase in impressions
Up by 20 positions
Unbranded Search:
+93% increase in clicks
+60% increase in impressions
Up by 31 positions
AI Visibility
Consistent qualified leads coming in from Google, Bing, and Ai Search